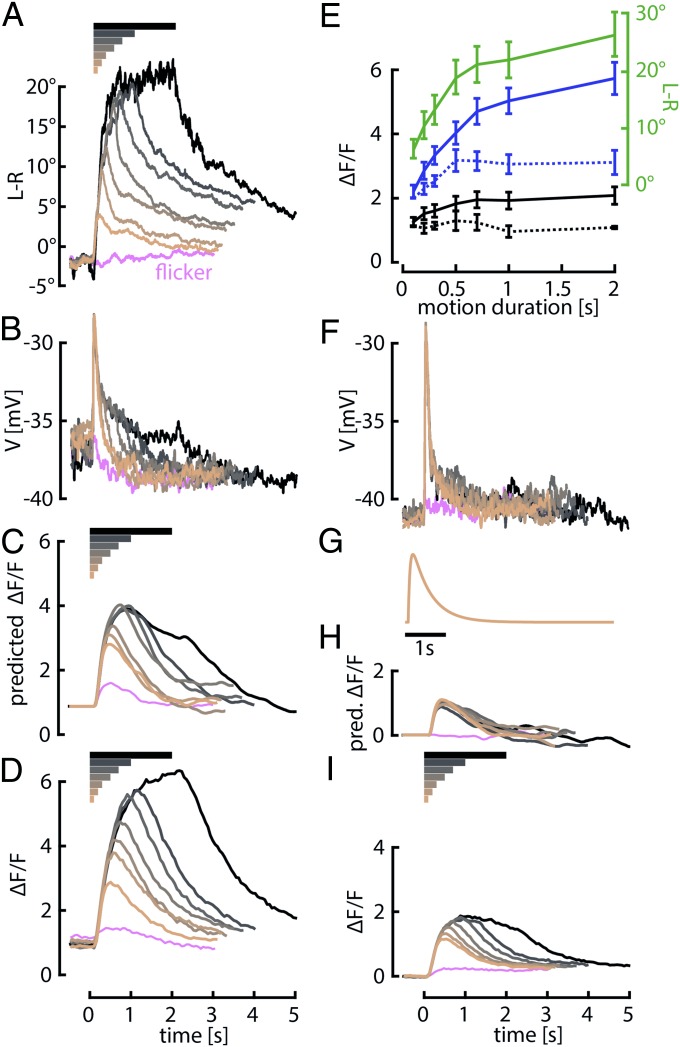
Fig. 3.
Behavioral and HS cell responses to motion stimuli of variable duration. (A) Mean behavioral responses of 15 intact wild-type flies to a large-field pattern rotating in the PD for a variable length of time (from 0 to 2 s, indicated by the horizontal bars above) and then remaining stationary for 3 s. Before the stimulus, flies performed closed-loop stripe fixation. (B) Mean membrane potential (V) of HS cells during flight in eight flies in response to the same stimuli. (C) Prediction of the fluorescence signal based on reported time constants of GCaMP6f estimated by convolving baseline-subtracted neuronal responses in B with the kernel shown in G. Predictions were normalized to the peak response of the shortest duration trial. (D) Measured GCaMP6f fluorescence changes (ΔF/F) in the terminals of HS cells of 21 flies during flight in response to similar stimuli as in A and B. (E) Mean and SEM of behavioral responses (green solid line) and peak predicted (dotted lines) and measured (solid lines) fluorescence changes during flight (blue) and quiescence (black) from A, C, D, H, and I plotted against stimulus duration. The baseline (mean during 0.5 s before open-loop stimulus) was subtracted from the measured GCaMP6f responses. (F, H, and I) Same as B–D, but during quiescence. (G) Kernel for predicting fluorescence changes purely based on GCaMP6f dynamics. Time constants for rise and decay (τ0.5) are 50 and 490 ms, respectively, and were chosen to match the prediction to the time course of the imaging data for the shortest duration stimulus (0.1 s) in D.

