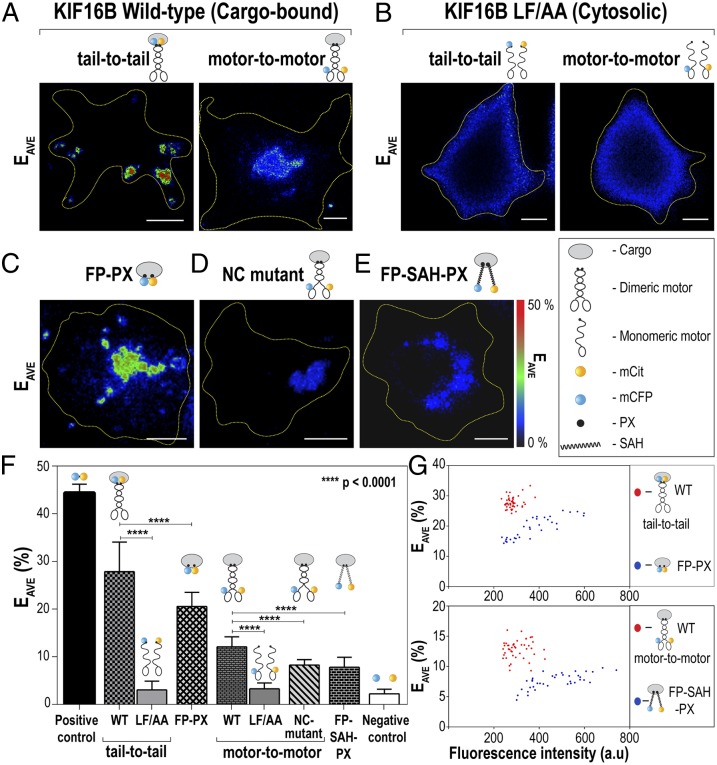
Fig. 1.
Full-length KIF16B motors dimerize on the cargo surface to drive transport. (A–E) Live cell FRET microscopy. COS-7 cells coexpressing (A) wild-type KIF16B tagged with FRET donor (mCFP) and acceptor (mCit) fluorescent proteins or (B) the cargo-binding mutant LF/AA tagged with mCFP and mCit were imaged by FRET microscopy. For tail-to-tail FRET (A and B, Left), FPs were fused to the C termini of the motors, whereas for motor-to-motor FRET (A and B, Right), FPs were fused to the N termini of the motors. (C–E) FRET controls. COS-7 cells coexpressing (C) donor and acceptor FPs targeted to the cargo surface via the monomeric KIF16B PX domain, (D) the N-terminally tagged KIF16B NC mutant, or (E) donor and acceptor FPs extended 30 nm from the cargo surface by a SAH between the FP and PX domains were imaged by FRET microscopy. Representative images of the calculated average FRET efficiency (EAVE) are shown. Yellow dotted lines indicate the outline of the cells. (Scale bars, 10 μm.) (F) Quantification of the FRET efficiencies in live COS-7 cells. For a negative control, the FRET efficiency between mCFP and mCit expressed as separate proteins was measured. For a positive control, the FRET efficiency between linked mCFP and mCit proteins (mCit-16aa-mCFP) was measured. n = 25–40 cells each over three independent experiments. The data are presented as mean ± SD. P values were calculated using the two-tailed t test. (G) Comparison of the FRET efficiency (EAVE) to protein concentration (measured as fluorescence intensity) on a cell-by-cell basis.

