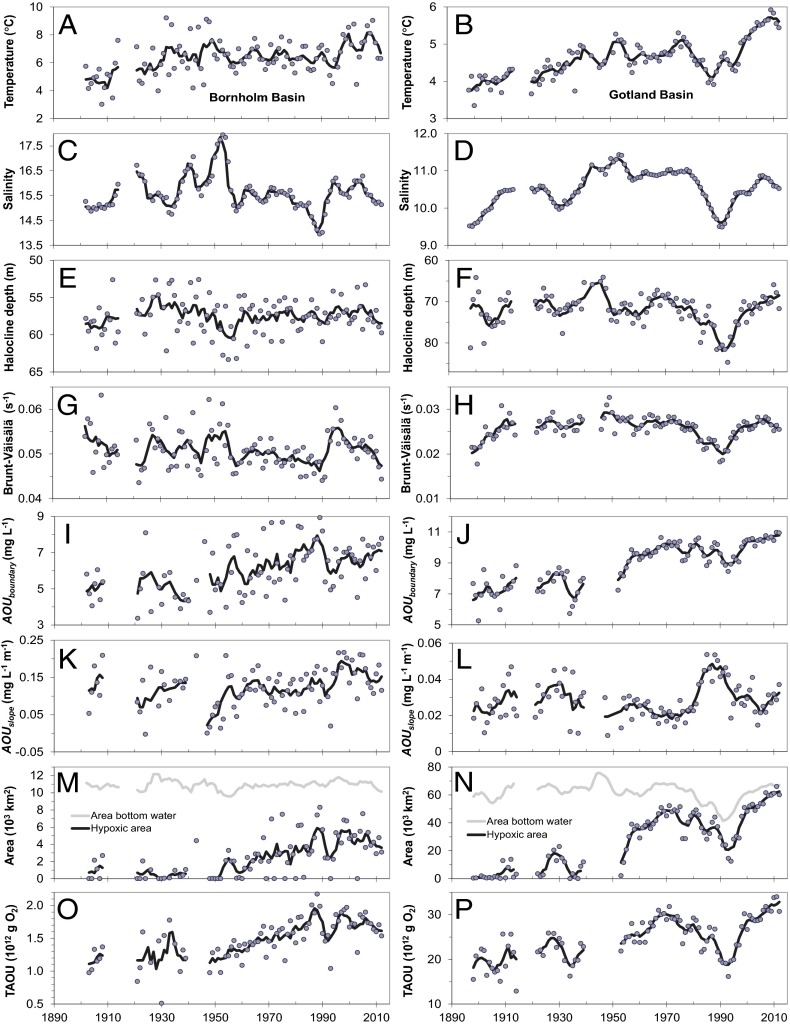
Fig. 1.
Long-term trends in temperature, salinity, and oxygen characteristics. The left panel show trends for the Bornholm Basin, and the right panel show trends for the Gotland Basin. Trends are temperature in the bottom layer (A and B), bottom-water salinity (C and D), depth location of the halocline (E and F), Brunt–Väisälä frequency, which is a proxy for stratification strength, calculated from the salinity profile parameters (G and H), apparent oxygen utilization (AOU) at the lower boundary of the discontinuity layer (I and J), change in AOU with depth below the discontinuity layer (K and L), areal extent of hypoxia (<2 mg⋅L−1) with the bottom area below the discontinuity layer (M and N), and total AOU below the discontinuity layer (O and P). The circles represent annual means and the solid black line is the 5-y moving average. A few outliers are not shown in the plots above but can be seen in Fig. S3 together with SEs of the annual means. Seasonal and spatial distributions of profile parameters are shown in Figs. S4 and S5.

