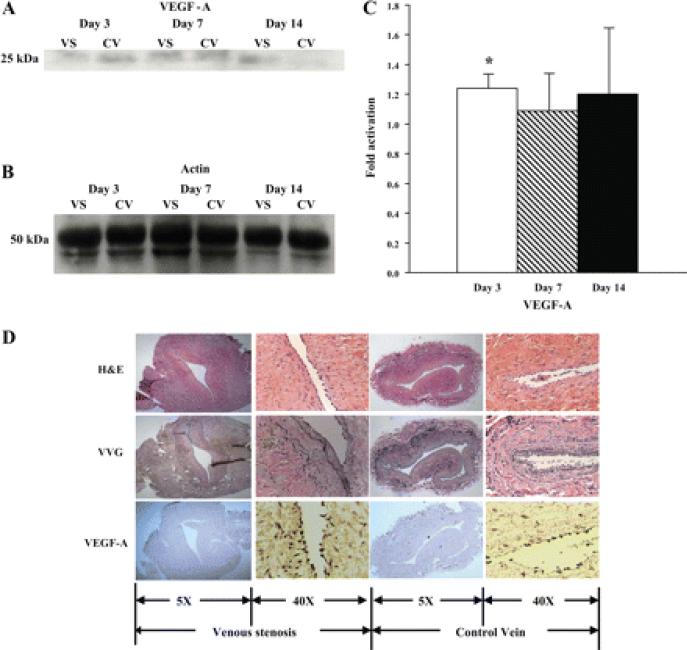
Fig. 5.
A: graph representing the appropriate protein band of VEGF-A from Western blot analysis. B: graph representing the appropriate band for β-actin from Western blot analysis for protein loading. C: semiquantitative analysis for VEGF-A performed on days 3, 7, and 14. The normalized density of VEGF-A was significantly higher at the vein-to-graft anastomosis compared with the control vein by day 3. *Significantly higher value (P < 0.05). Data are means ± SD. D: immunohistochemistry for VEGF-A for localization of expression on day 3. By immunohistochemistry, brown staining cells are positive for VEGF-A. Representative sections from a day 3 animal are shown. The left and middle left columns are from the vein-to-graft anastomosis, and middle right and right columns are from the control vein. The left and middle right columns are ×10 magnification, and the middle left and right columns are ×40 magnification. There were more cells staining brown located in the intima and media at the vein-to-graft anastomosis compared with controls

