Figure 1.

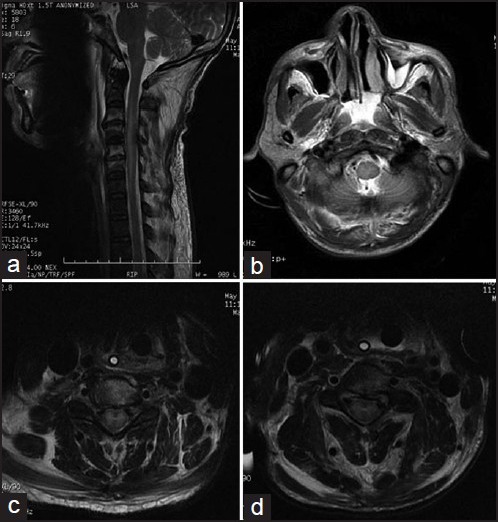
Panel a shows a long segment hyperintensity in the cervical cord on T2 weighted image (WI). Panels b-d show central cord hyperintensity. Panels c and d show intense grey matter hyperintensity on T2 WI

Panel a shows a long segment hyperintensity in the cervical cord on T2 weighted image (WI). Panels b-d show central cord hyperintensity. Panels c and d show intense grey matter hyperintensity on T2 WI