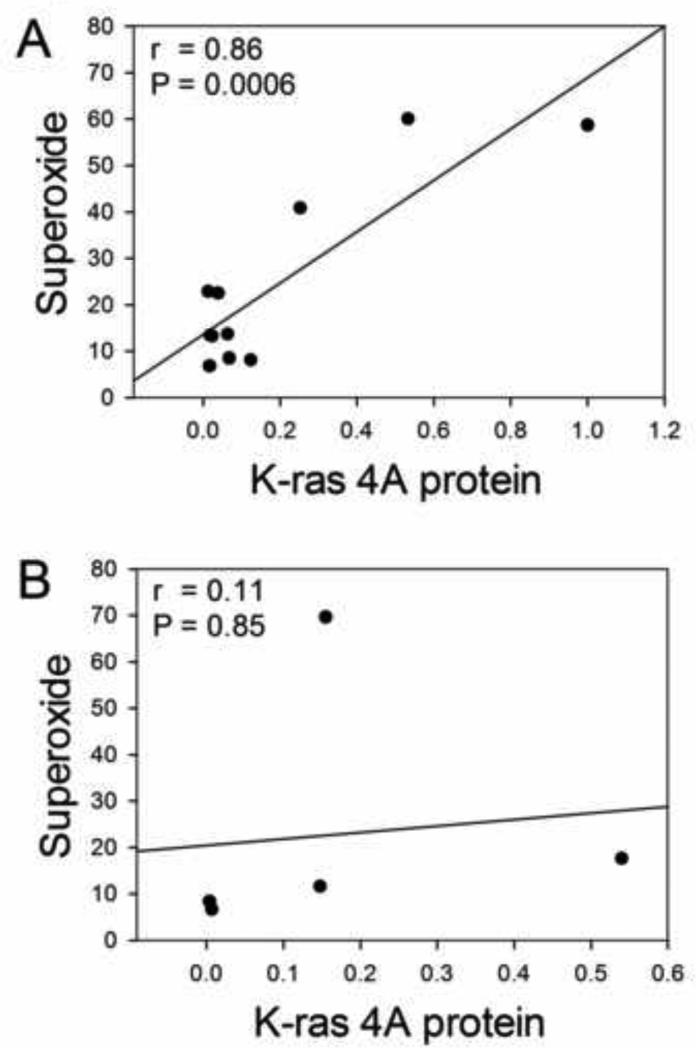
Fig. 2.
Correlations of average relative K-ras 4A protein levels with average superoxide levels (μmol nitro blue tetrazolium reduced in 30 min per mg total protein, from [9]). Significance values from Pearson correlations are given on the graphs. Correlation was strong for cell lines with mutant K-ras (A), but lacking in those with wildtype K-ras (B).

