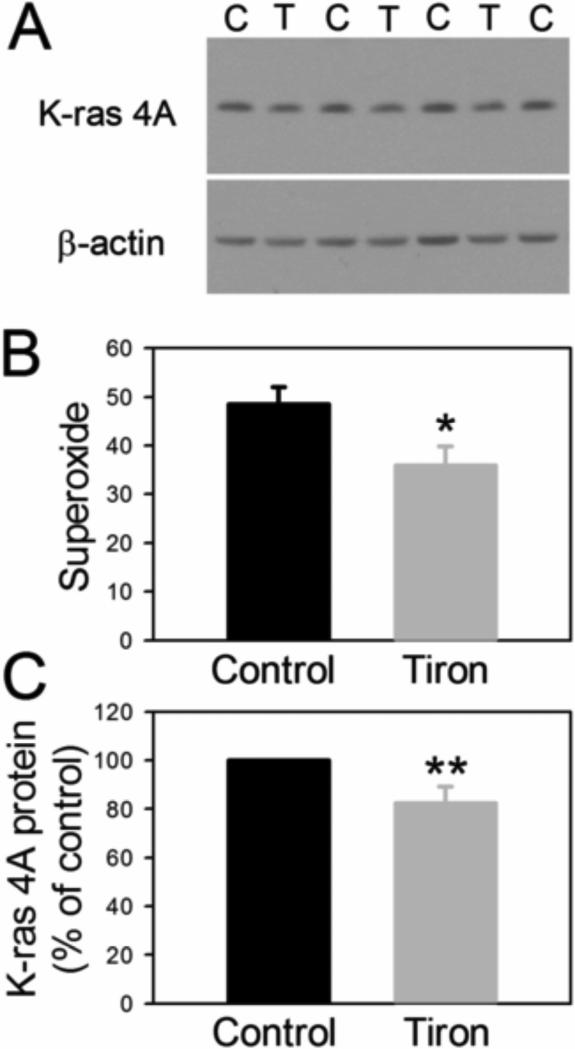
Fig. 4.
A. Representative western blot of K-ras 4A protein from H441 cells treated with 5 mM Tiron (C = control, T = Tiron). B. Average superoxide values for these cells (units defined in Fig. 2), *p = 0.0291. C. Levels of K-ras 4A protein normalized to the mean of controls for each blot, **p = 0.0476, two-tailed one sample t-test.

