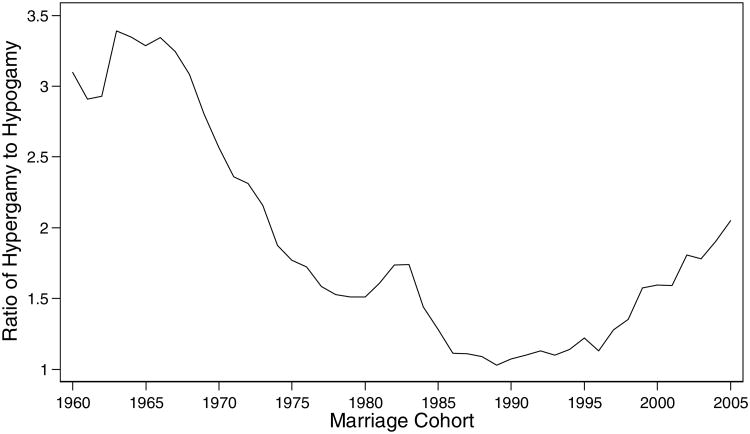
Figure 4. Relative Prevalence of Hypergamy to Hypogamy, 1960-2005.
Note: As shown are ratios of age hypergamy (percent couples with husband-minus-wife age gap larger than three years) to hypogamy (percent couples with husband-minus-wife age gap smaller than zero) for each marraige cohort of 1960-2005.
Source: National Bureau of Statistics of China, China 2005 1% Population Inter-census Survey.

