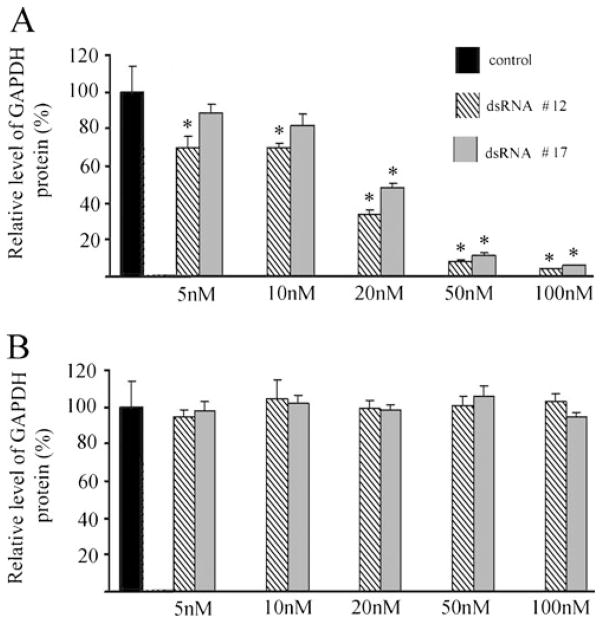
Fig. 5.
Quantitative analysis of the level of GAPDH and actin proteins after treatment by a tGAPDH dsRNAs #12 and #17 or b by scrambled dsRNAs #12 and #17 (n=3/group). Error bars indicate standard deviation. Asterisk indicates significant differences from the controls which were treated with tranfection agent alone

