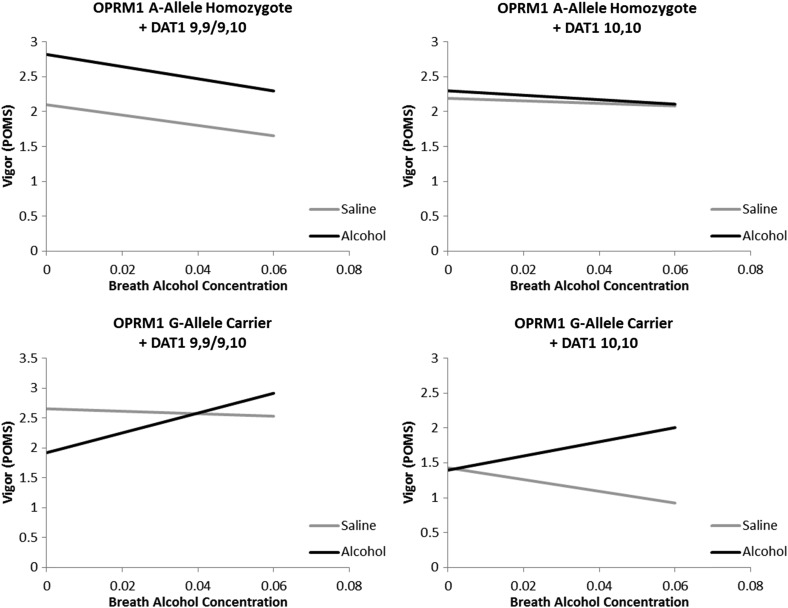
Fig. 2.
Best fitting regressions line as determined by the model in block 3 (i.e. without a four-way interaction) predicting Vigor from the POMS from alcohol infusion condition (Alcohol versus Saline), Time (0.00–0.06 BrAC or time equivalent), OPRM1 genotype (A-allele homozygote versus G-allele carrier) and DAT1 genotype (9,9/9,10 versus 10,10) controlling for sex, ethnicity, smoking status, FTND score, DPDD, and ADS score. A significant difference between alcohol and placebo infusion averaging across time was observed for OPRM1 A-allele homozygotes + DAT1 A9 carriers and OPRM1 G-allele carriers + DAT1 10,10 homozygotes.

