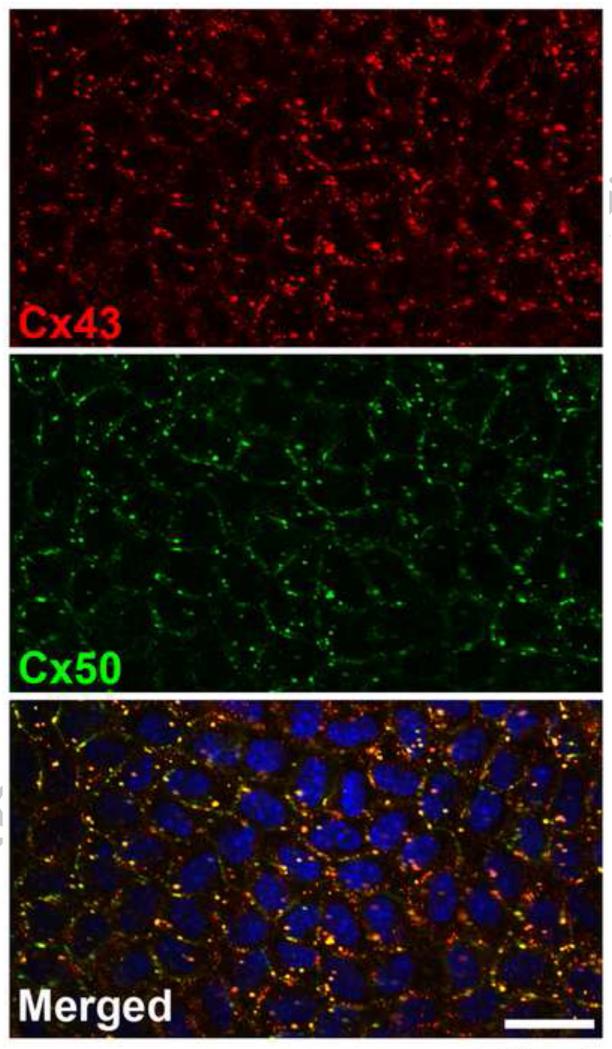
Figure 1.
Immunofluorescence of Cx43 and Cx50 in the epithelium. Confocal images showing the distribution of Cx50 (green) and Cx43 (red) in a flat mount of the epithelium removed from the lens of a 1.9 month old C3H mouse. These images illustrate the variations in relative proportions of Cx43 and Cx50 and their co-localization. In some areas, cells have an increased proportion of Cx43 whereas in other areas, cells show an increased proportion of Cx50 punctate staining. While some of the cells show a high degree of co-localization between the two connexins, others show a more uniform punctate staining with some co-localization between Cx43 and Cx50. Bar, xx μm

