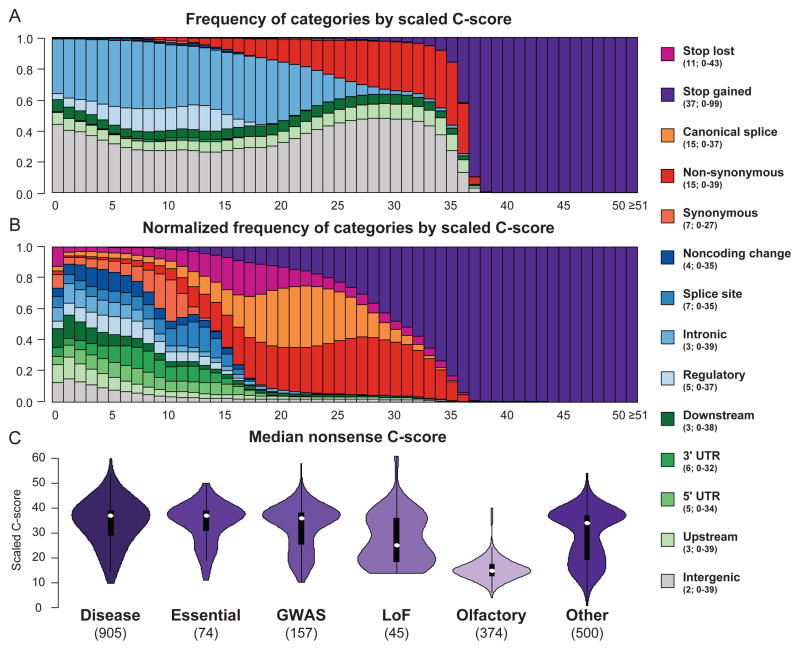
Figure 1.
Relationship of scaled C-scores and categorical variant consequences. The upper plot shows the proportion of substitutions with a specific consequence for each scaled C-score bin, while the middle panel shows the proportion of substitutions with a specific consequence after first normalizing by the total number of variants observed in that category. The legend indicates the median and range of scaled C-score values for each category. Consequences are obtained from the Ensembl Variant Effect Predictor16 (Supplementary Note), e.g. “noncoding change” refers to changes in annotated non-coding transcripts. Detailed counts of functional assignments in each C-score bin are in Supplementary Table 8. The lower panel shows violin plots of the median C-scores of potential nonsense (stop-gained) variants for genes that: harbor at least 5 known pathogenic mutations48 (“disease”); are predicted to be “essential”23; harbor variants associated with complex traits41 (“GWAS”); harbor at least 2 loss-of-function mutations in 1000 Genomes49 (“LoF”); encode olfactory receptor proteins; or are in a random selection of 500 genes (“Other”; see Supplementary Note).

