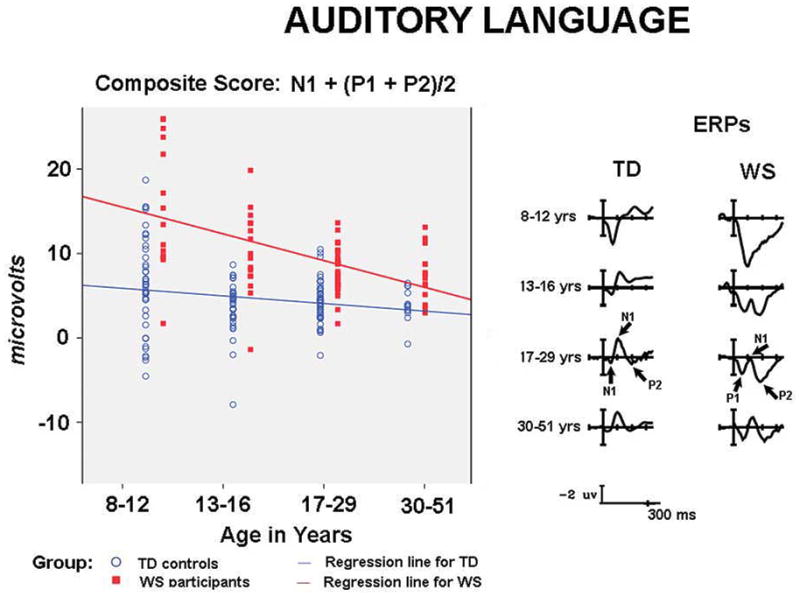
Figure 4.

ERPs and composite scores for auditory language processing. The right side of the figure shows ERPs to auditory language stimuli in the first 300 ms, showing the large P1 and P2 and small N1 pattern observed in children and adults with WS. In contrast TD children and adults show a large N1 and reduced amplitude P1 and P2 responses. The left side illustrates individual variability in composite scores (N1 + mean of P1and P2) for WS and TD children and adults, showing that the WS pattern becomes more similar to TD controls with increasing age.
