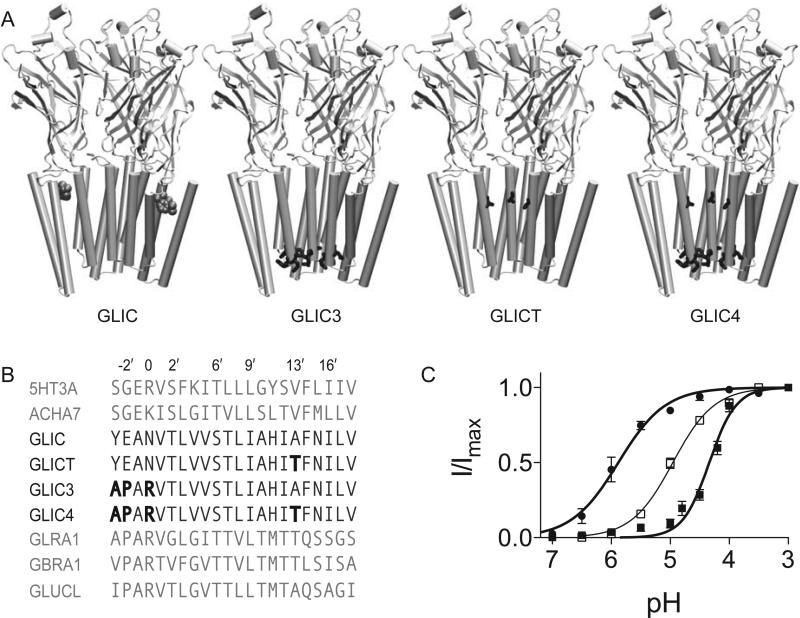
Figure 1. Mutagenesis of GLIC.
(A) View of GLIC and the indicated mutant constructs in the plane of the membrane with the front two subunits removed to show the interior of the pore. Propofol is shown in space-filling representation at its binding site. The residues with the following mutations are indicated in their respective constructs: Y–3′A, E–2′P, N0′R and A13′T (B) Alignment of GLIC with select members of the pLGIC family with the mutations in GLIC3, GLICT and GLIC4 indicated in bold. Pore facing residues are numbered. The sequences above the GLIC constructs are cation channels; the sequences below are anion channels. (C) pH response curves for GLIC4 (■) and GLICT (●). The pH corresponding to the EC50 was 5.9 and 4.3 for GLICT and GLIC4, respectively. The data are fit to the Hill equation. Error bars represent standard error, n=7 oocytes.

