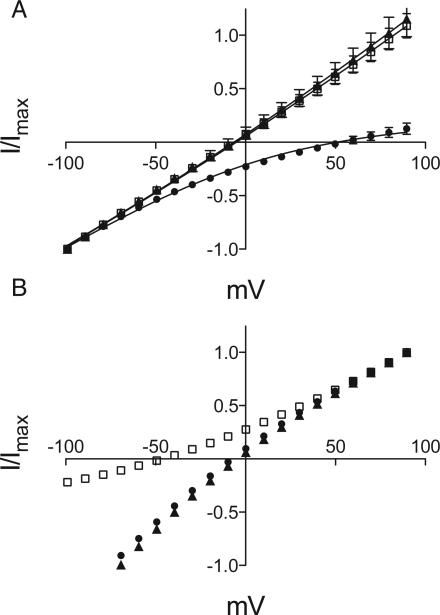
Figure 2. GLIC4 is selective for Cl–
(A) Asymmetric IV curves for GLIC4 with 130 mM NaCl (▲), choline chloride (◻) or sodium gluconate (●) in the external solution. Error bars represent standard error, n=5. The 60 mV positive shift in reversal potential on replacement of chloride with gluconate is indicative of chloride selectivity. Permeability ratios were obtained from global nonlinear regression to the Goldman-Hodgkin-Katz equation (solid lines). (B) Asymmetric IV curves for GLICT. The legend is the same as for (A). Error bars (smaller than the symbol size) represent standard error, n=5. The 45 mV negative shift in reversal potential on replacement of sodium with choline is indicative of sodium selectivity.

