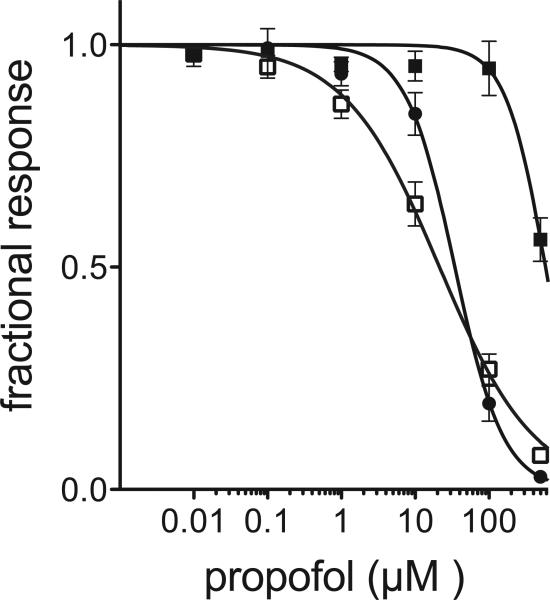
Figure 4. Propofol inhibition of GLIC (◻), GLICT (●) and GLIC4 (■).
Fractional current is plotted as a function of propofol concentration at the pH corresponding to the EC20 for the pH activation of each construct. Error bars represent standard error, n=5. IC50 for propofol inhibition are 21, 35 and 584 μM for for GLIC, GLICT and GLIC4, respectively.

