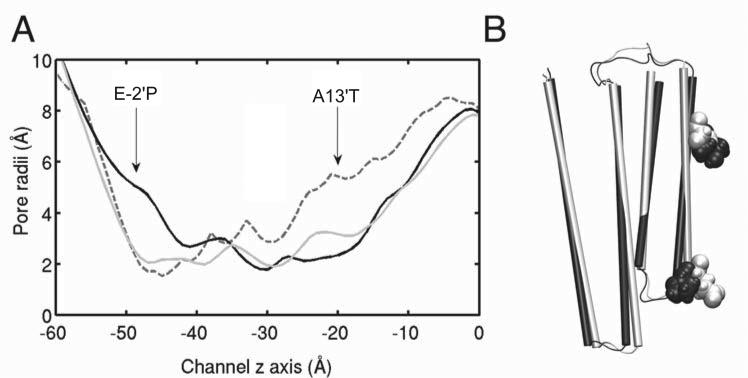
Figure 6. Changes in the GLIC4 pore.
(A) Comparison of the pore radii of the X-ray structure of GLIC (gray dashed line), the MD equilibrated structures of GLIC (gray solid line) and GLIC4 (black solid line) after simulations for 50 ns. Simulation results were averaged based on 100 snapshots near 50 ns and from three replicate runs. The standard deviation of the averaged pore radii in the TM domain is within 0.3 Å. (B) Alignment of a representative equilibrated GLIC (white) with a representative equilibrated GLIC4 (black) after 30 ns simulations. E–2′ in GLIC and E–2′P in GLIC4 are in VDW presentation. For clarity, only the transmembrane domain of one subunit is shown.

