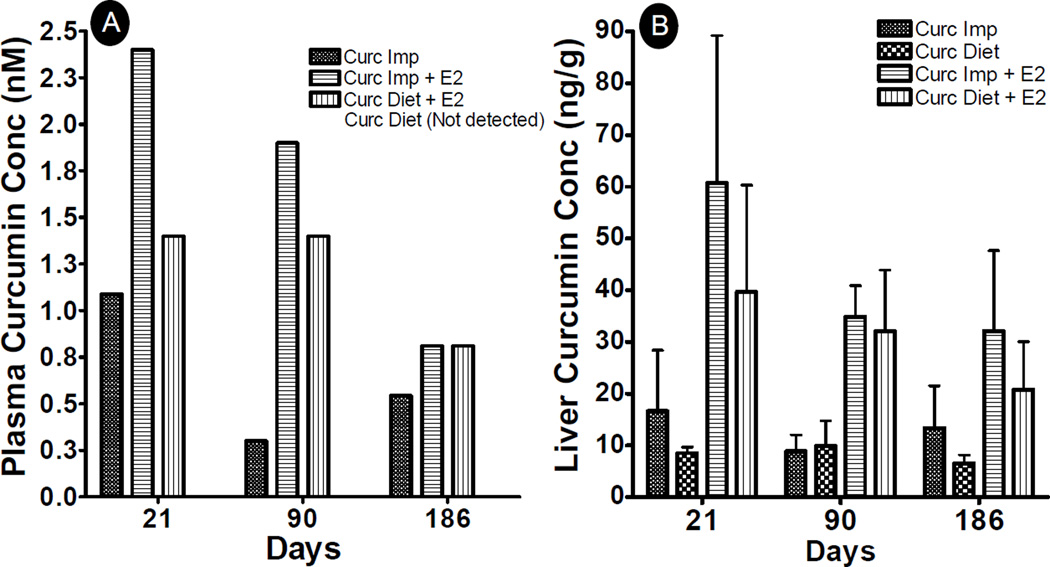
Fig. 6.
Plasma (A) and liver (B) curcumin concentrations in female ACI rats treated with sham or E2 implant along with either two sham polymeric implants (2 cm), or two curcumin implants (2 cm, 20% load) or curcumin diet (1,000 ppm) for over a period of 3 weeks, 3 months and 6 months. Plasma was pooled from all the animals (n=6) in each group during 3 week and 3 month time points, and from every 3rd animal from 6 month time point, acidified and extracted with ethyl acetate. The dried residue was reconstituted in acetonitrile and analyzed by HPLC.

