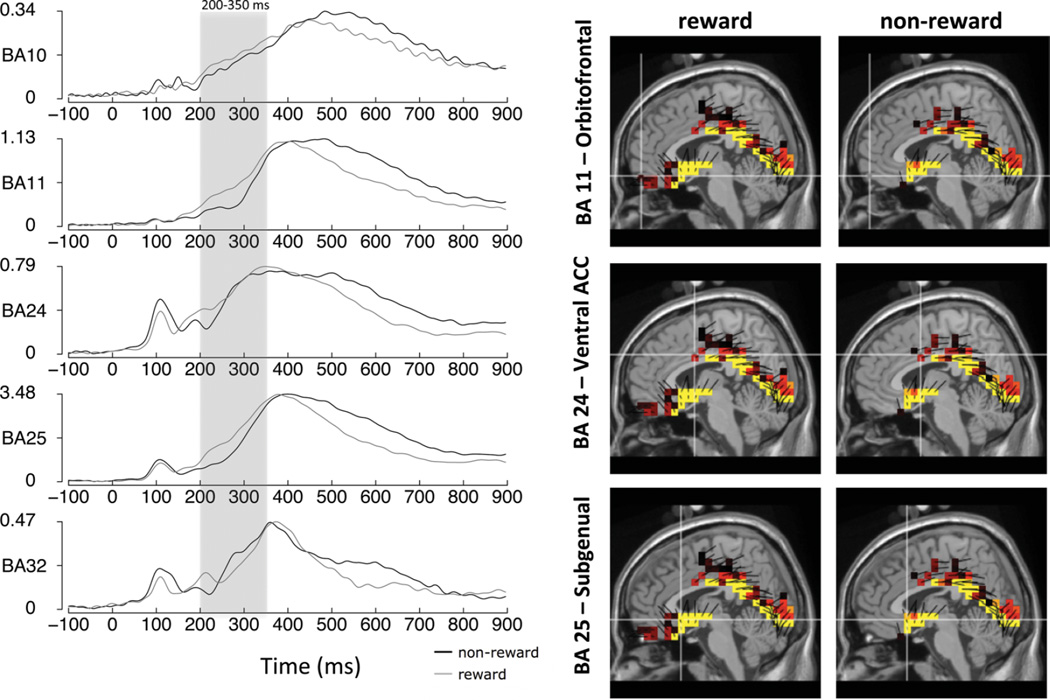
FIGURE 5.
Source waveforms for Brodmann areas BA 10 (anterior prefrontal cortex), BA 11 (orbitofrontal cortex), BA 24 (ventral ACC), BA 25 (subgenual cortex), and BA 32 (dorsal ACC) (left), measurement units in nanoamperes. Note that, for emphasis, the source waveform y-axes vary from plot to plot. Shown on the right are S-low-resolution electromagnetic tomography (LORETA) source models for regions (BA 11, BA 24, BA 25) that were significantly different across reward and non-reward conditions. (color figure available online)

