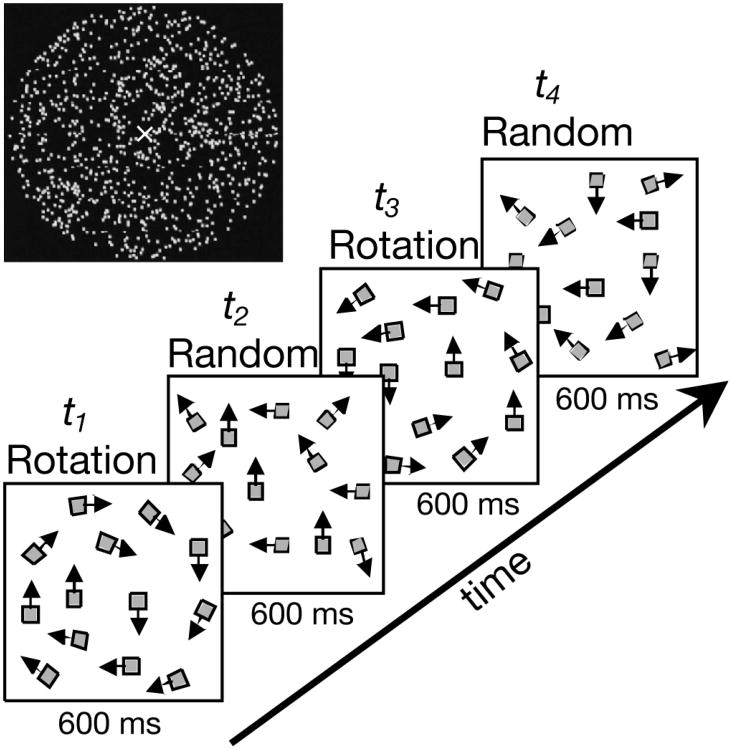
Figure 1.
Schematic illustration of the stimuli. A random-dot kinematogram was used. A full cycle of the stimulus consisted of 0.6 s of circular coherent motion (clockwise) followed by 0.6 s of incoherent motion, followed by 0.6 s of anticlockwise motion, followed by 0.6 s of incoherent motion. The position of individual dots was shifted over a fixed spatial displacement at each temporal update in both coherent and incoherent phases of the display. VEP responses were measured over a wide range of dot displacements (Δx) at three dot-update frequencies (1/Δt's of 15, 20 and 30 Hz).

