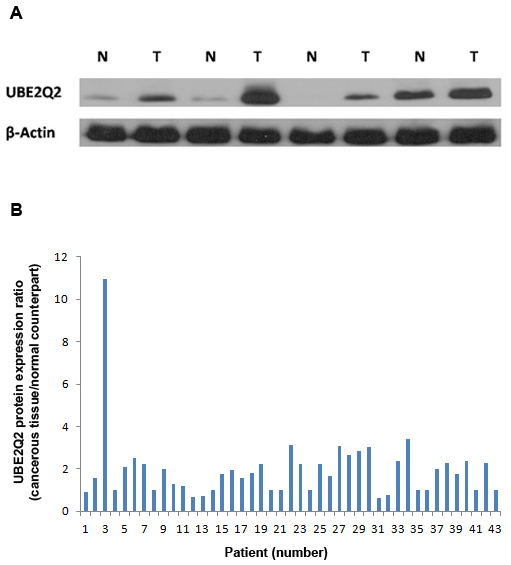
Figure 3.

Expression of UBE2Q2 in colorectial tumors and their corresponding normal tissues. A) Immunoblot analysis using UBE2Q2 antibody (detecting ~43 KDa protein bands) against the extracts from four normal human colorectal tissue samples (N) and their corresponding cancerous counterparts (T). Anti β-actin antibody was used to normalize differences in the amount of protein that was loaded into wells. B) Relative expression levels of the UBE2Q2 protein in the colorectal tumors from 43 patients. Data are presented as the ratio of the levels of UBE2Q2 protein in the cancerous tissue to those in its normal counterpart. The level of the UBE2Q2 protein was assessed by densitometric quantitation of the intensity of the signal from the UBE2Q2 blot in relation to that of the actin band as control.
