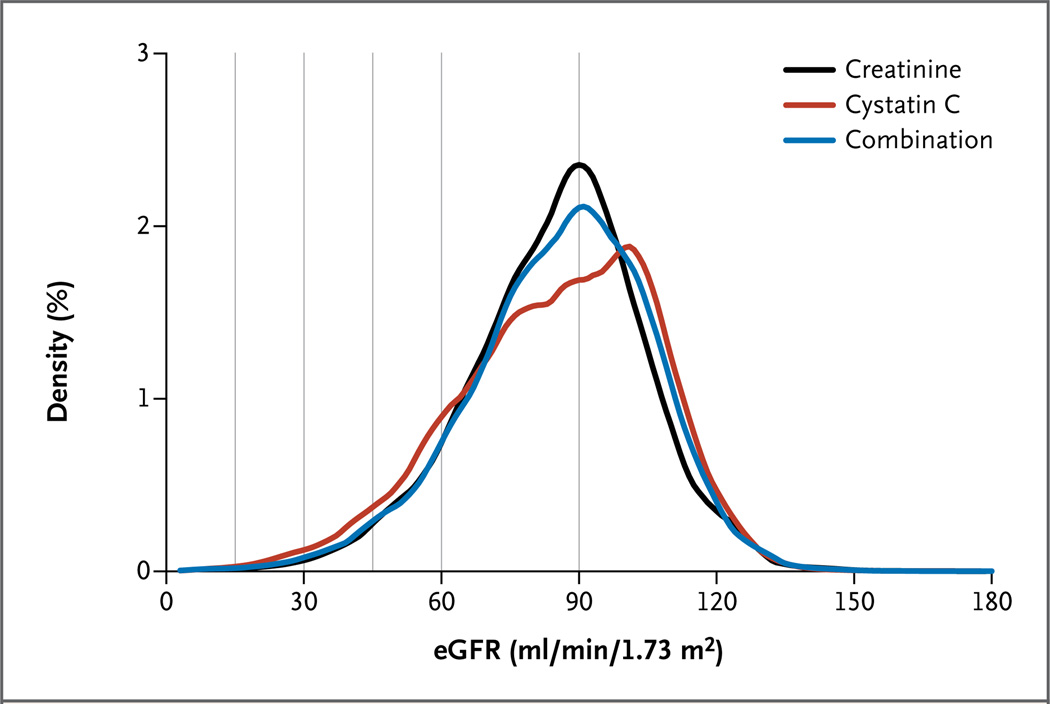
Figure 1. Distribution of the Estimated Glomerular Filtration Rate (eGFR) as Calculated with the Measurement of Creatinine, Cystatin C, or Both in 11 General-Population Cohort Studies.
A total of 90,750 participants were included in the meta-analysis of 11 studies, with a kernel-density estimate showing the smoothed frequency for each 1 ml of the eGFR value. The vertical lines indicate current clinical thresholds for eGFR categories.

