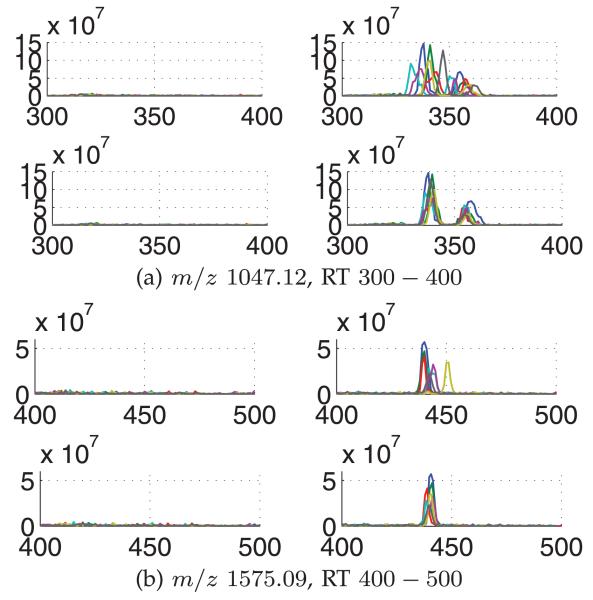
Fig. 8.
EICs for selected m/z values of 1,047.12 and 1,575.09. For each m/z value, four plots showing the chromatograms of all seven replicates are depicted: chromatograms for aliquots with serum alone (left) and serum with spiked-in peptides (right) are shown before alignment (top) and after alignment by BAM (bottom).

