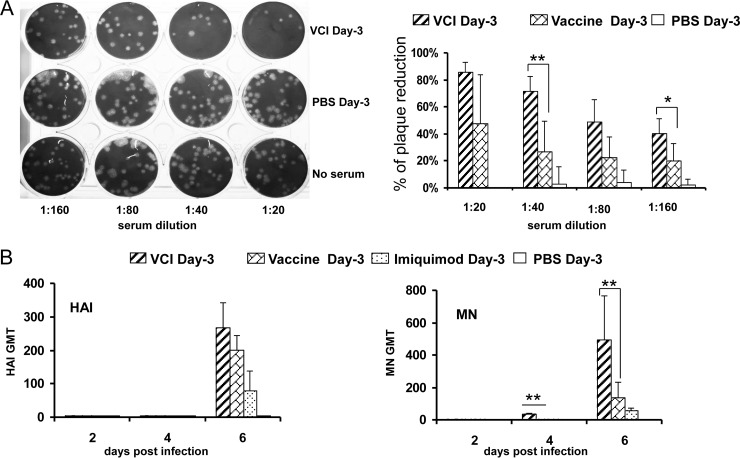
FIG 7.
Neutralizing antibody titers in mouse sera. All mice received different immunization regimens on day −3. (A) Representative image of plaque inhibition by diluted sera collected on day 4 p.i. (left). The percentage of inhibition of plaque formation was calculated against the negative control (no serum), which was taken as 100%. Data represent the means plus standard deviations (right). (B) HAI and MN assays of sera collected at various time points postinfection. GMTs of HAI (left) and MN (right) antibodies are shown. n = 7 to 9 per group. Error bars indicate standard deviations. *, P < 0.05; **, P < 0.01 (compared with the vaccine day −3 group).

