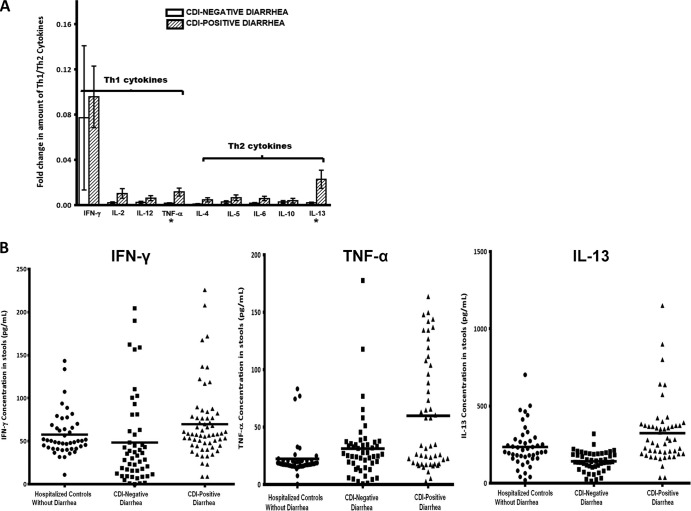
FIG 4.
Comparison of Th1 and Th2 cytokines in CDI-positive and CDI-negative stools. (A) Fold change in amounts of Th1 cytokines (IFN-γ, IL-2, IL-12, TNF-α) and Th2 cytokines (IL-4, IL-5, IL-6, IL-10, IL-13) obtained from the initial Proteome Profiler human cytokine array assay. Stools (300 mg) from 100 antibiotic-associated diarrheal patients (50 CDI positive and 50 CDI negative) were evaluated for the presence of 36 inflammatory proteins using a Proteome Profiler human cytokine array panel A kit (R&D Systems, Minneapolis, MN). Data are expressed as the mean of the relative band intensity of each cytokine. Stools from the hospitalized patients (controls) without diarrhea were not evaluated by this initial assay but were included retrospectively in the quantitative ELISA for comparison. Error bars represent the standard error of measurement between two replicates per sample. *, P < 0.05. (B) Concentrations of IFN-γ, TNF-α, and IL-13 in CDI-positive stools and CDI-negative stools from diarrheal patients and stools from hospitalized controls without diarrhea determined by quantitative ELISA (R&D Systems, Minneapolis, MN). The Kruskal-Wallis test showed significant differences between the means (P < 0.0001). Horizontal bars, mean concentrations.

