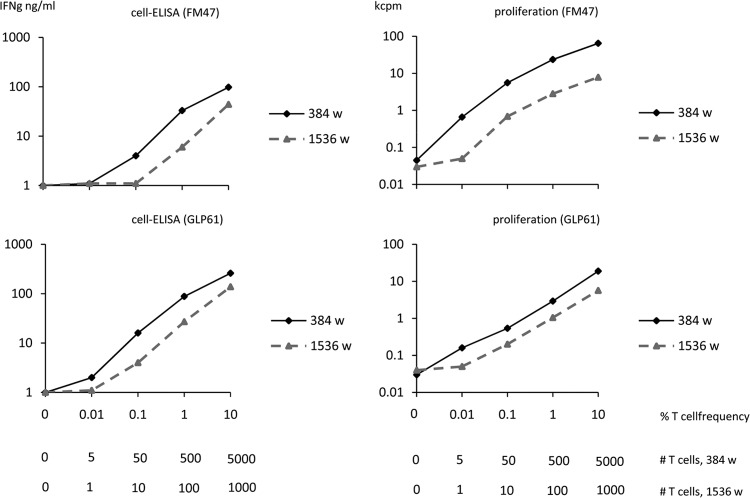
FIG 6.
Titration of HIV-specific T-cell lines spiked in autologous PBMC. The left panels indicate cell-ELISA results and the right panels indicate lymphoproliferation results. Upper graphs refer to an HIV gp120-specific T-cell line generated from donor FM47, while lower graphs refer to an HIV reverse transcriptase-p66-specific T-cell line generated from donor GLP61. Graded numbers of specific T cells were titrated in autologous irradiated PBMC as a source of antigen-presenting cells. Titrations were performed in 384- and 1,536-well plates. The horizontal axes indicate the percentage of T cells versus total PBMC, and the absolute numbers of specific T cells per well at the different dilutions for the two formats.

