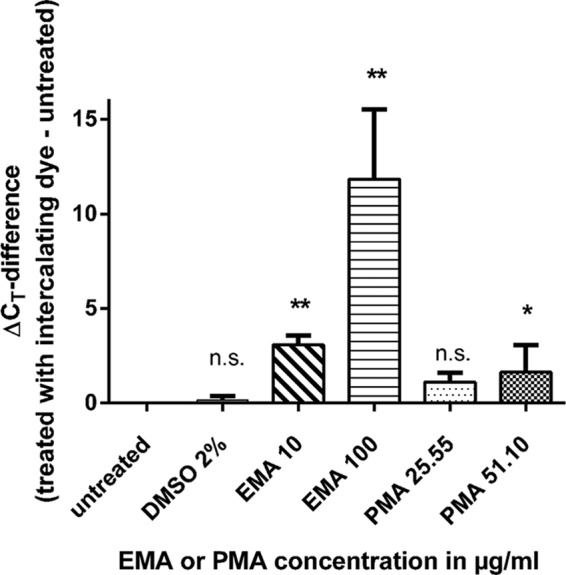
FIG 1.

Differences in CT values between qPCR results from approximately 2 × 10⁶ Campylobacter cells pretreated with either an intercalating dye or the solvent DMSO, 2% (vol/vol), in relation to untreated cells. Results are shown as averages from three independent experiments. Significant differences compared with untreated cells are indicated by asterisks (ANOVA; *, P < 0.05; **, P < 0.005; n.s., not significant).
