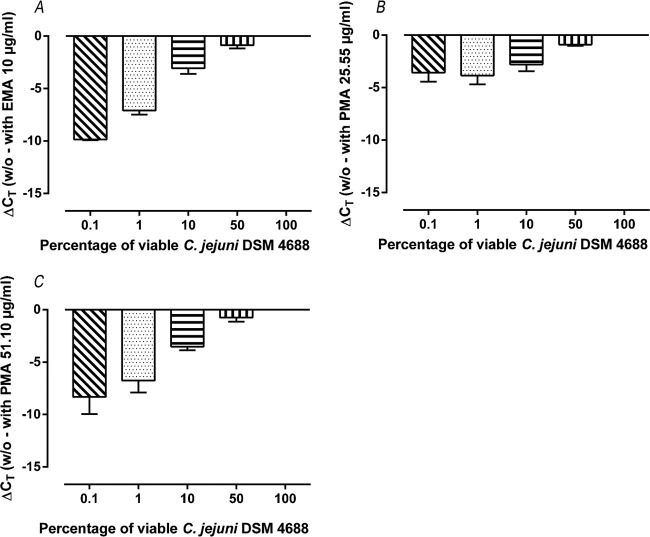
FIG 2.
Signal reduction of qPCR experiments, defined as difference between CT values obtained from a sample without pretreatment with an intercalating dye (w/o) and the CT value derived from the respective sample pretreated with an intercalating dye. Results are shown as averages from three independent runs using 10 μg/ml EMA (A), 25.55 μg/ml PMA (B), or 51.10 μg/ml PMA (C). For all experiments, C. jejuni DSM 4688 was used and analyses were carried out using various percentages of viable cells.

