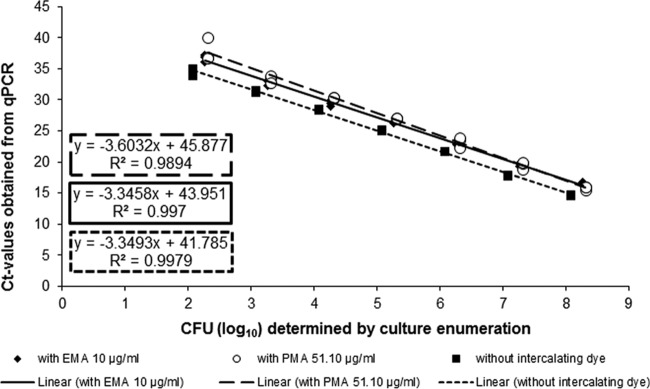
FIG 4.

qPCR standard curves obtained from 10-fold dilution series of cell suspensions from Campylobacter jejuni DSM 4688 in the presence or absence of EMA at 10 μg/ml or PMA at 51.10 μg/ml. Experiments were repeated three times independently. The equation of the regression curves and the R2 values are indicated.
