
FIG 5.
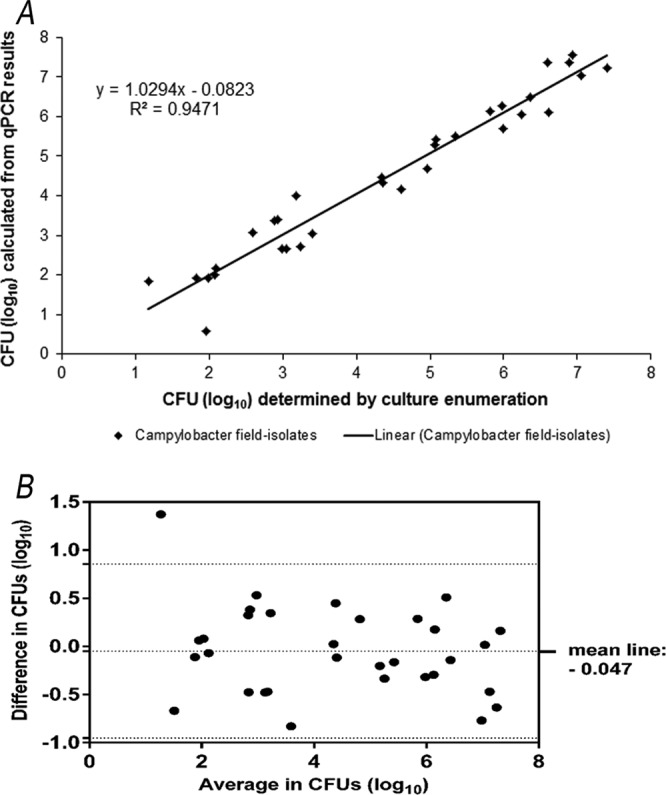
Correlation between Campylobacter cell counts of 16 field isolates plus reference strains C. jejuni DSM 4688 and C. coli DSM 4689 calculated from EMA-qPCR results and bacteriological enumeration and demonstrated by a scatter plot (A) and Bland-Altman plot for CFU determined by enumeration and qPCR results (B). In panel B, the middle line represents the mean difference of methods. Dotted lines above and below represent 95% limits of agreement.