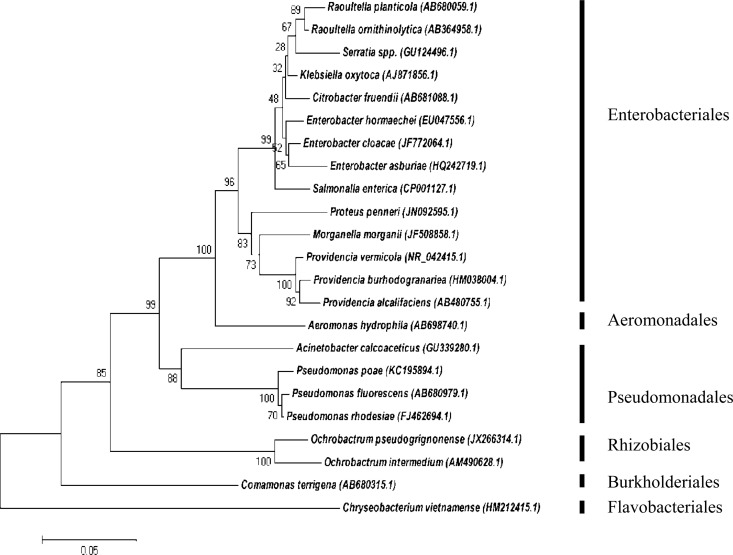
FIG 1.
Phylogenetic tree illustrating the evolutionary history of bacteria, constructed during sampling session one by means of the maximum composite likelihood function (evolutionary history) and neighbor-joining method within the program MEGA 5. The numbers found adjacent to the nodes represent the data (percentages) from 1,000 exploratory bootstrap trials. Bar, 0.05 changes per site. Six distinct orders are clustered together, representing the Enterobacteriales, Aeromonadales, Pseudomonadales, Rhizobiales, Burkholderiales, and Flavobacteriales. The increased amount in bacterial diversity may be attributed to the fact that obtained isolates were cultured on two different selective media.

