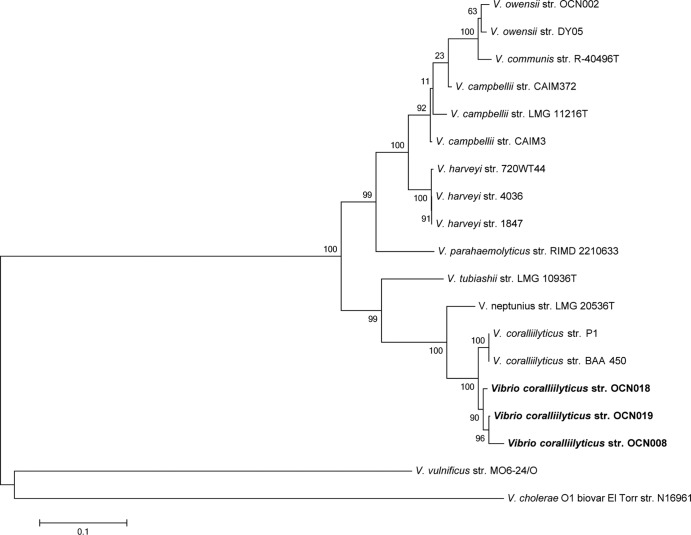
FIG 1.
Phylogenetic tree of MLSA. Evolutionary history was inferred using the maximum likelihood method. The tree with the highest log likelihood is shown. The percentage of trees in which the associated taxa clustered together is shown next to each branch. The scale bar represents 0.1 nucleotide substitution per site.

