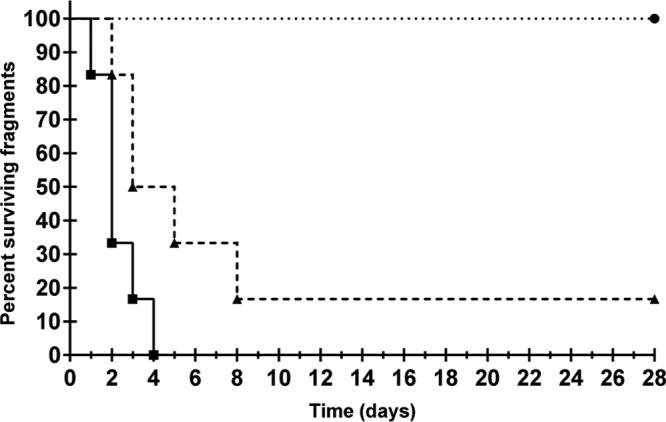
FIG 3.

Kaplan-Meier survival curve of M. capitata in infection trials at 23 and 27°C. The percentage of surviving corals over time is plotted. Solid line, 27°C (n = 6); dashed line, 23°C (n = 6); dotted line, 23°C or 27°C with the control bacterium or FSW alone (results for each were identical). The concentration of bacteria was 108 CFU/ml of seawater.
