
FIG 4.
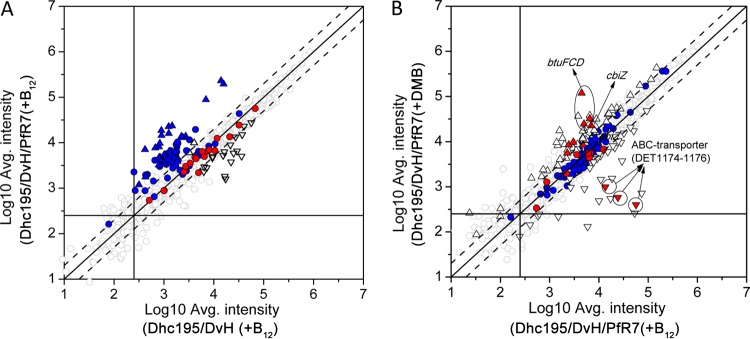
Global transcriptomic analysis of Dhc195 grown in Dhc195/DvH/PfR7(+B12) triculture compared to Dhc195/DvH(+B12) coculture (A) and Dhc195/DvH/PfR7(+DMB) triculture compared to Dhc195/DvH/PfR7(+B12) triculture (B). Dashed lines indicate 2-fold differences. Solid lines indicate an average intensity of 250 on the x or y axis (genes with signal intensities greater than 250 were considered to be actively transcribed). Upward- and downward-pointing triangles indicate up- and downregulation, respectively; red indicates corrinoid-related genes, and blue indicates phage-related genes. Differential expression is determined by the following criteria: FDR of <0.05, >2-fold change, and >250 signal intensity under at least one of the two conditions.