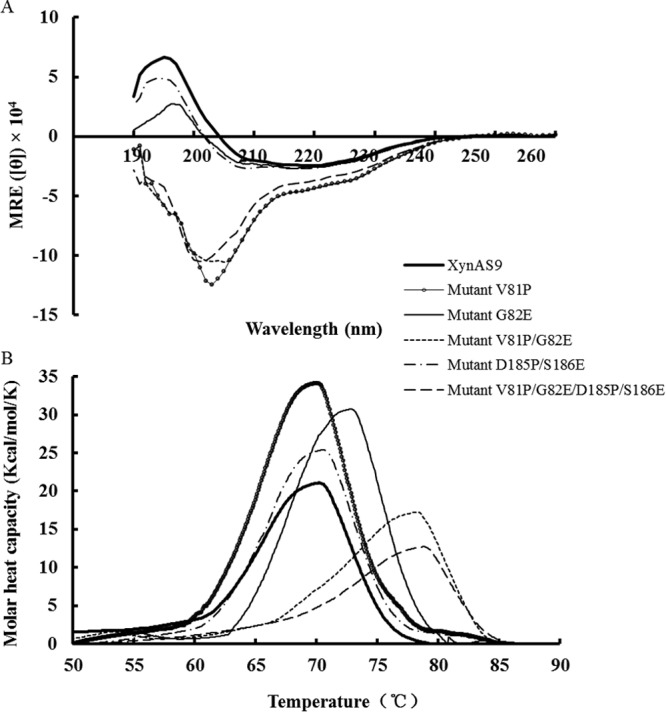
FIG 4.

(A) Far-UV CD spectra of wild-type XynAS9 and its mutants in 10 mM PBS (pH 7.4); (B) thermograms, measured using DSC. The calorimetric recordings for XynAS9 and its mutants were scanned at 1°C/min in 10 mM PBS (pH 7.4) with the protein concentration of 350 μg/ml, respectively.
