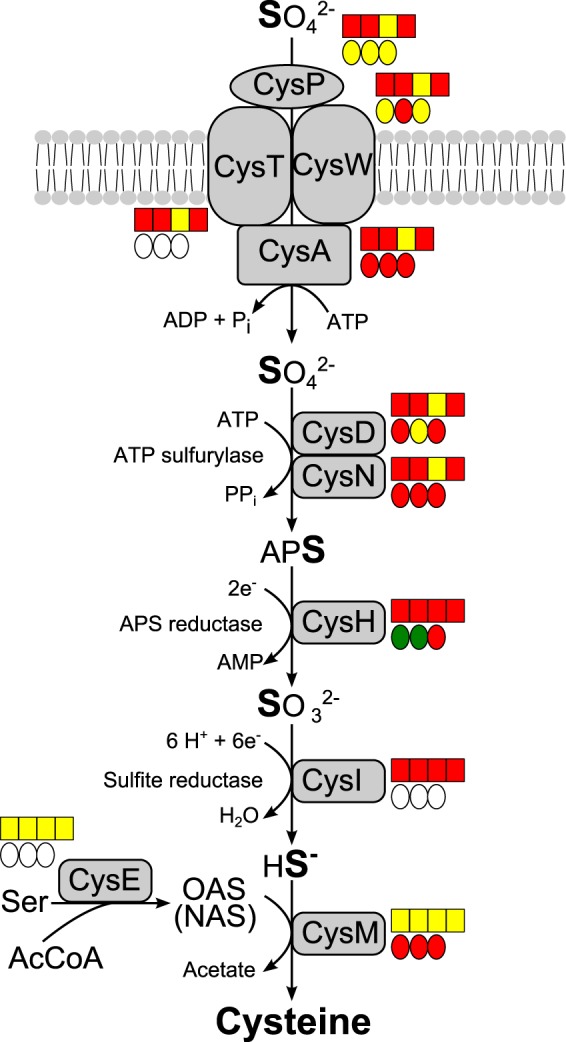
FIG 2.

Pathway of assimilatory sulfate reduction in Allochromatium vinosum. The proteomic profiles (circles) and transcriptomic profiles (boxes) are depicted next to the respective proteins. Relative fold changes in mRNA levels above 2 (green) were considered significant enhancement. Relative changes smaller than 0.5 (red) were considered to indicate significant decreases in mRNA levels. Relative fold changes between 0.5 and 2 (yellow) indicated unchanged mRNA levels. The same color coding is applied to changes at the protein level. Here, values above 1.5 (green) and below 0.67 (red) were considered significant. Those cases where transcriptomic data were not available or the respective protein was not detected in the proteomic approach are indicated by white squares or circles. Sulfur compounds added, from left to right, are sulfide, thiosulfate, elemental sulfur, and sulfite. Changes on sulfite were not determined on the proteome level. APS, adenosine-5′-phosphosulfate; OAS, O-acetylserine; NAS, N-acetylserine.
