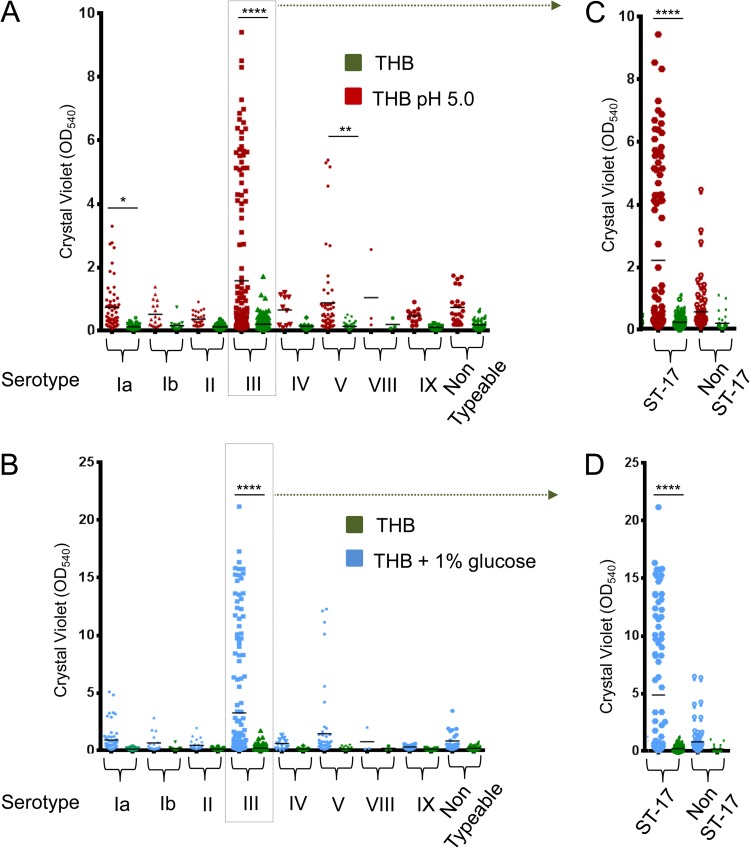
FIG 2.
Effects of an acidic pH and glucose on GBS biofilm formation. Shown are the biofilm-forming abilities of 366 GBS clinical isolates of eight different serotypes and nontypeable strains grown in THB (green dots) or pH 5.0 THB (red dots) (A) or in THB (green dots) or THB supplemented with 1% glucose (red dots) (B). Panels C and D focus on serotype III strains clustered into ST-17 and non-ST-17 groups. Biofilm formation was evaluated by CV assay. Each dot represents the mean value of three independent experiments performed with each isolate. Asterisks denote statistically significant differences determined by ANOVA (*, P < 0.05; **, P < 0.01; ****, P < 0.0001).

