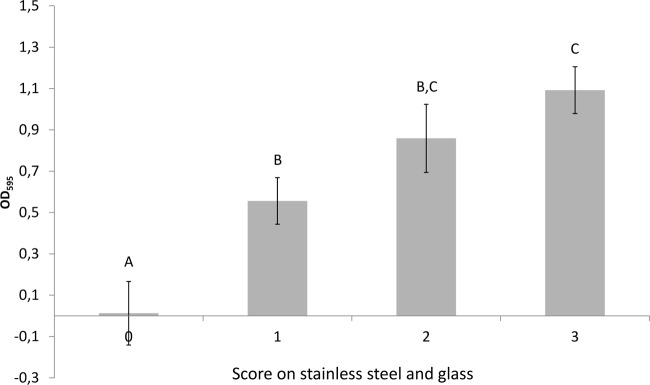
FIG 4.

Mean OD595 values in microtiter plate assay of subset of 12 isolates with different biofilm formation scores on glass slides and steel coupons. Results from all temperatures are included. Bars represent standard deviations (SD). Different letters signify that the means are statistically different at a P value of <0.05.
