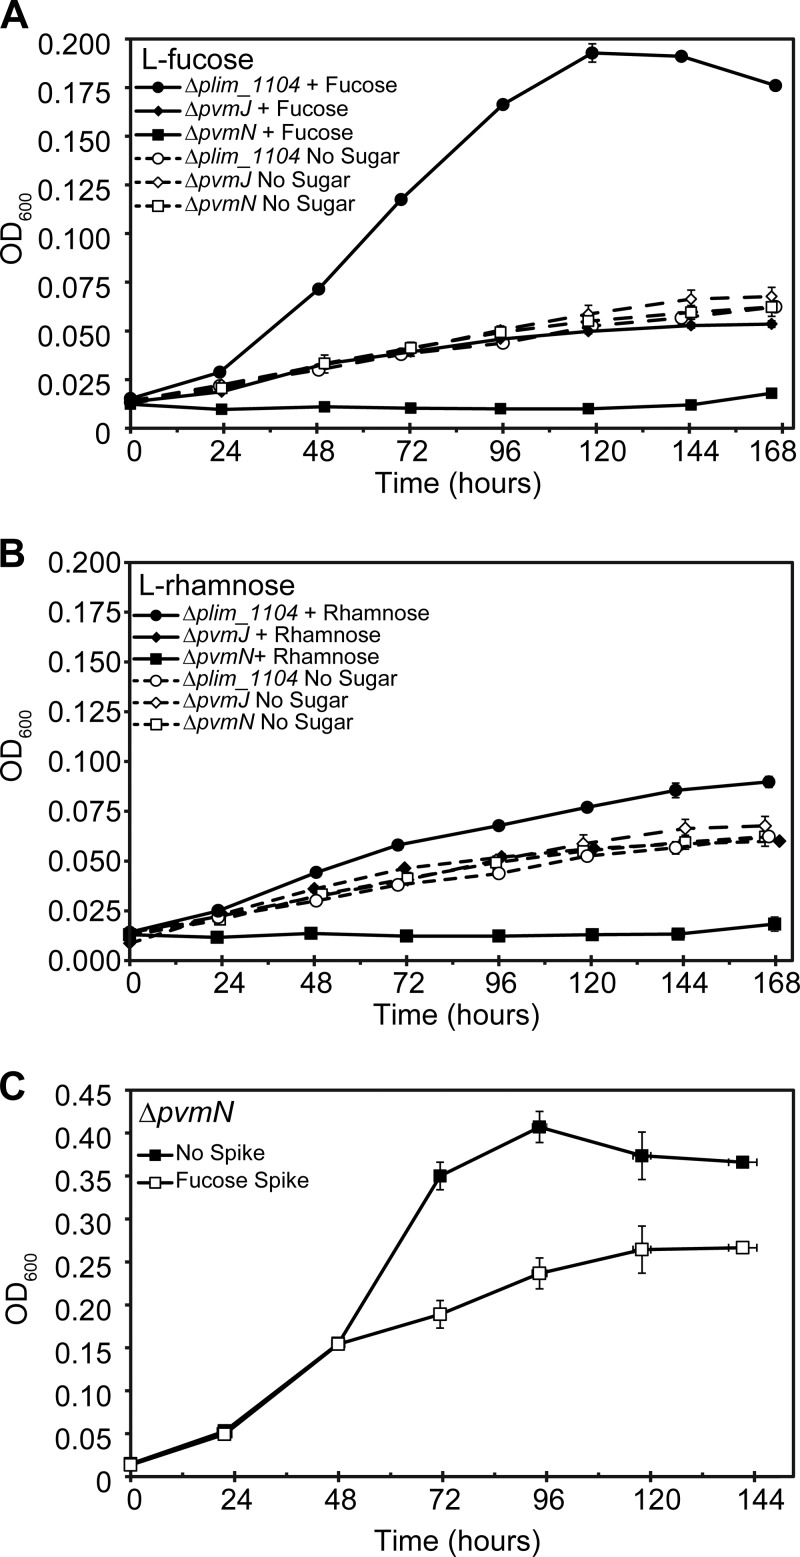
FIG 3.
Growth curves of Δplim_1104, ΔpvmJ, and ΔpvmN strains grown on l-fucose (A) and l-rhamnose (B). “No sugar” data in panel B are reproduced from panel A. (C) Spiking experiment in which the ΔpvmN strain was grown on 5 mM d-glucose for 2 days, at which point 5 mM l-fucose was added to half of the cultures. Solid squares represent nonspiked cultures, and open squares represent cultures with l-fucose added. In all graphs, each data point is an average of three independently grown cultures (n = 3); each error bar represents 1 standard deviation.

