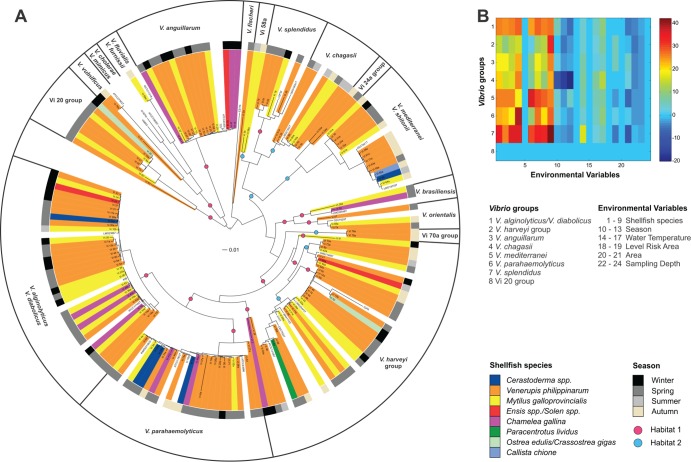
FIG 1.
(A) Phylogenetic tree of the Vibrio population analyzed in this work. The colored rectangles refer to the biological source of the strains (shellfish species). The middle ring shows the seasons of sampling. The 17 Vibrio groups inferred by Structure are reported in the outer ring. The colored circles on the tree branches represent the two habitats predicted by AdaptML. (B) CCA pattern, showing canonical correlation between variables. The plot shows the correlation between the most represented Vibrio groups inferred by Structure and the environmental categories considered in this study. The environmental variables are as follows: 1, V. philippinarum; 2, C. gallina; 3, M. galloprovincialis; 4, C. gigas; 5, O. edulis; 6, C. chione; 7, Cerastoderma spp.; 8, Ensis spp./Solen spp.; 9, P. lividus; 10, winter; 11, spring; 12, summer; 13, autumn; 14, 6 to 10°C; 15, 11 to 15°C; 16, 16 to 20°C; 17, 21 to 30°C; 18, A; 19, B; 20, lagoon; 21, sea; 22, 0 to 100 cm; 23, 101 to 200 cm; 24, >200 cm. The color bar (canonical coefficients) indicates the ranges of correlations among variables.

