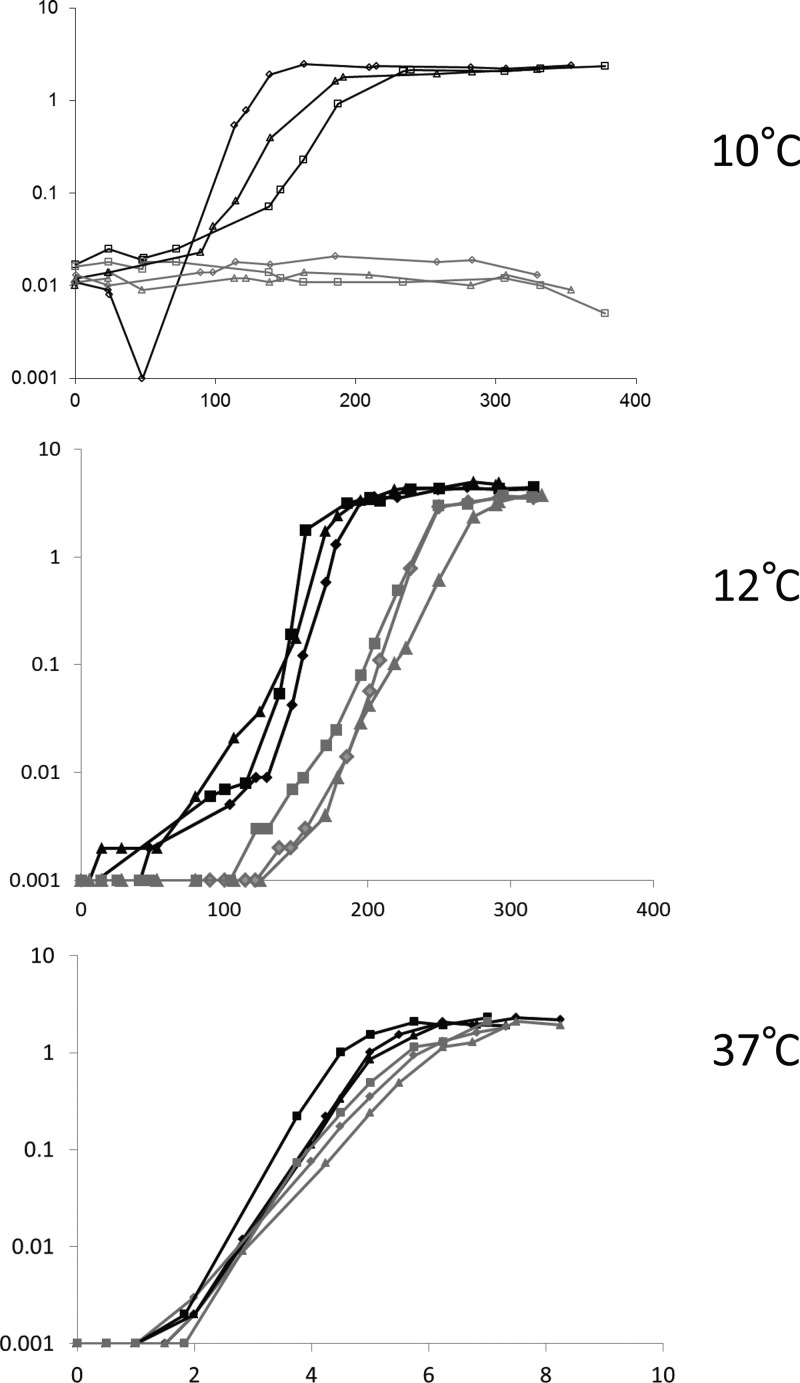
FIG 1.
Growth curves of B. cereus wt and ΔBC_2216-17 strains at various temperatures. Growth of the wt (black) and ΔBC_2216-17 (gray) strains was performed in 100 ml LB at the indicated temperature under shaking. Three biological replicates are shown for each condition (different symbols represent different replicates). During the lag phase at 10°C, cells sometimes formed temporary small aggregates which caused a decrease in the measured OD. y axes indicate the ODs at 600 nm; x axes indicate times (in hours).

