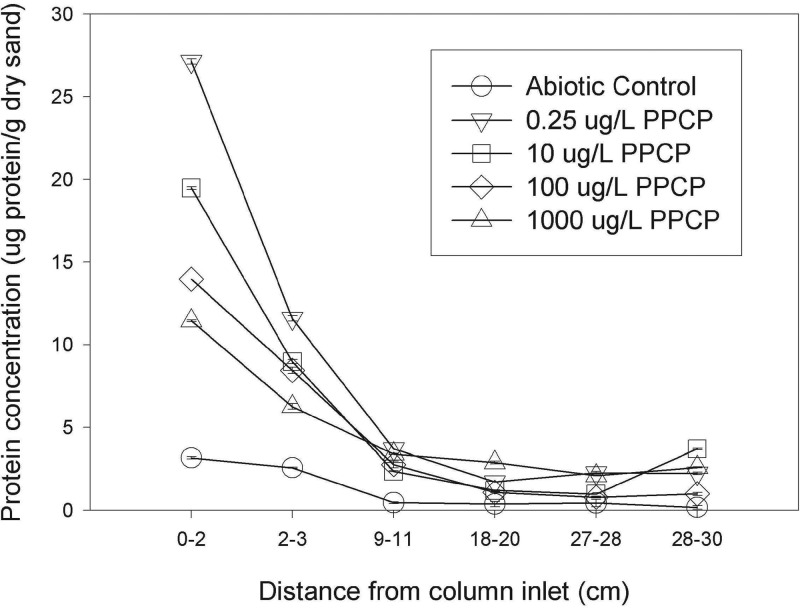
FIG 2.
Protein concentrations in column segments. Columns were disassembled and subsampled at specified segment depths on day 343. Protein concentrations for the biomass associated with each segment are presented as micrograms of protein per gram of dry sand. Data shown are the means from duplicate assay measurements of the same column sample, and error bars represent the range of the two measurements. Nonvisible error bars mean that the bars are contained within the data marker.

