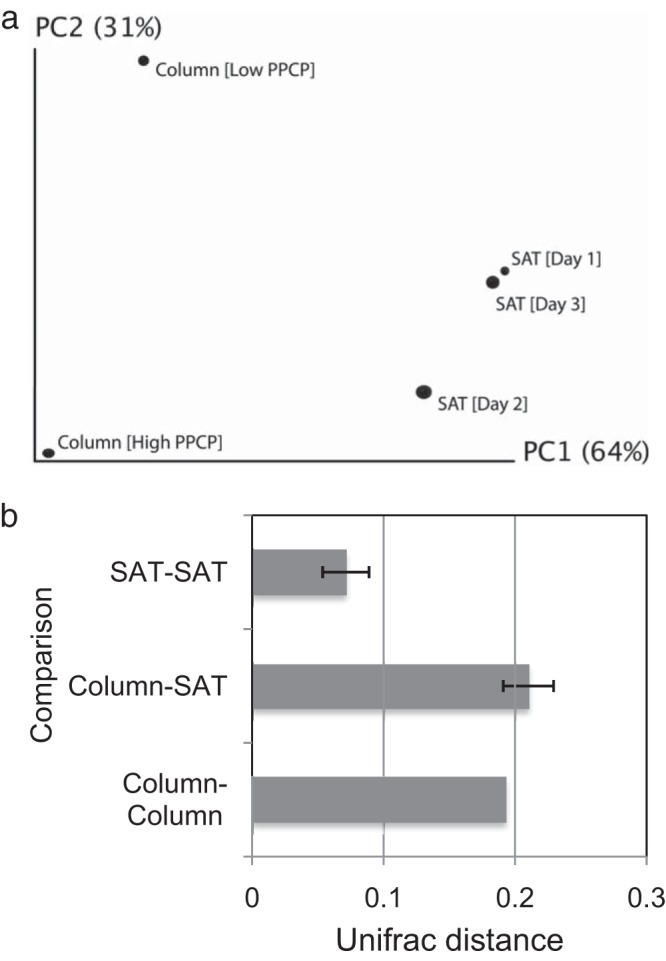
FIG 3.

(a) Results of a principal coordinates analysis (PCoA) based on weighted UniFrac distances with 95% confidence intervals represented by the size of the symbol. (b) Community dissimilarity as represented by a plot of the UniFrac distance for three comparisons: SAT-SAT, column-SAT, and column-column. Error bars represent 95% confidence intervals.
