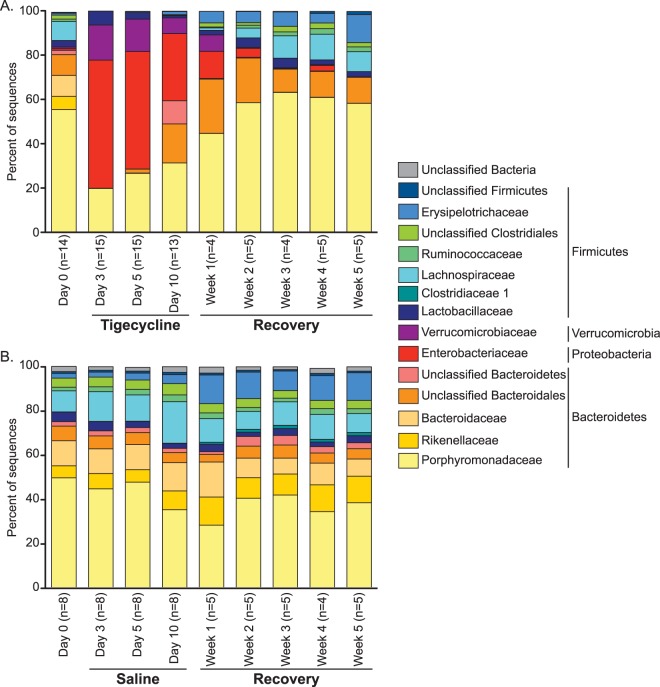
FIG 2.
Average bacterial community composition changes during tigecycline treatment and recovery. The bar graphs depict the mean percent abundances of the top bacterial families (≥1% relative abundance at a minimum of one time point) prior to and during tigecycline treatment (A) or saline treatment (B) and recovery. The family-level percent abundances were based on the classification of a subsample of 3,572 bacterial 16S rRNA gene sequences per sample. The respective phyla are listed to the right of the family names.

