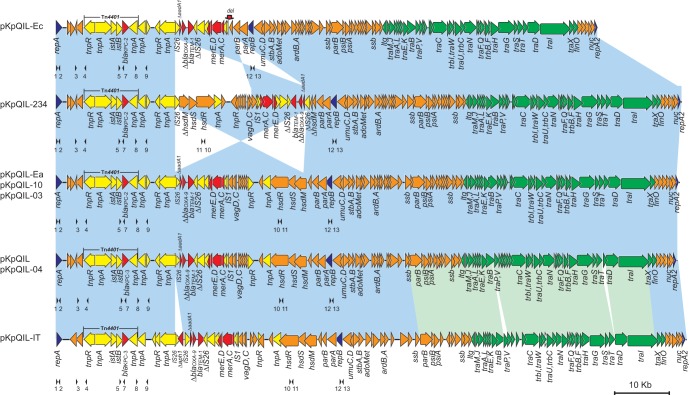
FIG 1.
Comparative analysis of pKpQIL-like plasmids. Light-blue shading denotes shared regions of homology with >99% identities, while light-green shading indicates homologies with ∼97% identities. ORFs are portrayed by arrows and colored based on predicted gene function. Orange arrows indicate plasmid scaffold regions. The genes associated with the tra locus are indicated by green arrows, and replication-associated genes are denoted as dark-blue arrows. Antimicrobial and mercury resistance genes are indicated by red arrows, while the accessory genes are indicated by yellow arrows. We note that a 24-kb region is inversely displayed in pKpQIL-234, in contrast to other pKpQIL-like plasmids. A red arrow above plasmid pKpQIL-Ec illustrates the deletion site of 14-kb sequence. Small black arrowheads beneath the plasmids indicate the locations of primers used for PCR screening; primer sequences are shown in Table 1.

