
FIG 3.
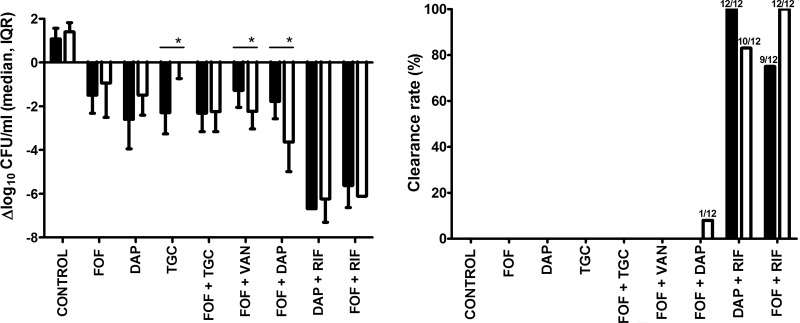
Antimicrobial activity against planktonic MRSA. (A) Bacterial counts during therapy (closed bars) and 5 days after the end of therapy (open bars), compared to the initial bacterial counts on day 3 (before treatment). Positive values denote net bacterial growth, and negative values denote net bacterial killing. Values represent medians and interquartile ranges (IQR). Asterisks indicate therapy regimens exhibiting significant differences in bacterial load during therapy versus 5 days after the end of therapy (P < 0.05). (B) Clearance rate of planktonic MRSA in aspirated cage fluids, during therapy (closed bars), and 5 days after the end of therapy (open bars). For each treatment group, 12 cages were used (i.e., 3 animals each implanted with 4 cages). The numbers of MRSA-free cage fluid samples divided by the total number of cages in each therapy group are indicated on the bars. Control, untreated animals; DAP, daptomycin; FOF, fosfomycin; RIF, rifampin; TGC, tigecycline; VAN, vancomycin.