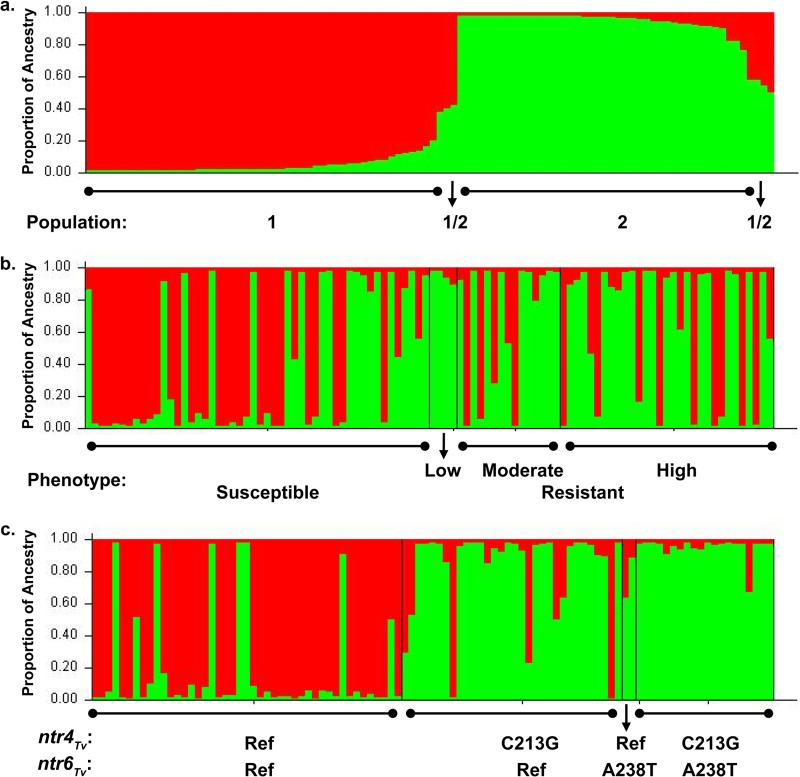
FIG 3.
T. vaginalis population structure. Red represents ancestry from population 1, and green represents ancestry from population 2. (a) Total population sorted by Q (ancestry vector) (100 isolates), (b) population sorted by ascending MLC values (100 isolates), and (c) population sorted by ntrTv genotype (99 isolates, 1 excluded due to undetermined ntr6Tv genotype).

