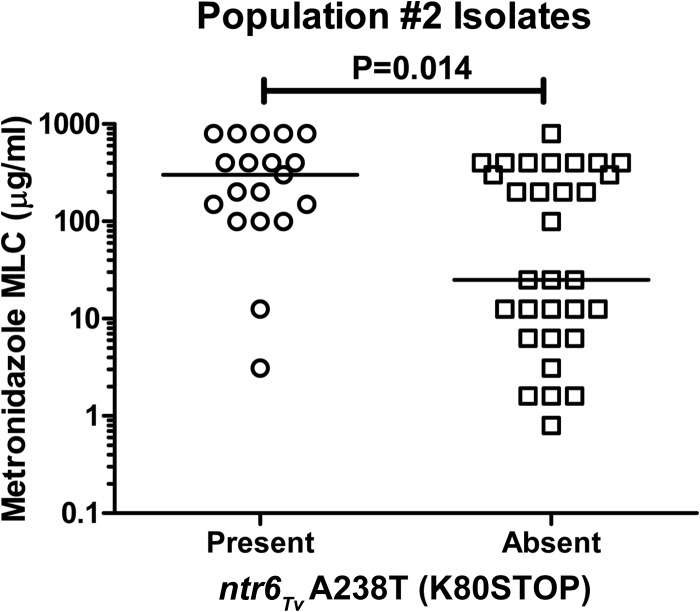
FIG 4.
Distribution of metronidazole MLC values within 50 population 2 isolates by presence or absence of ntr6Tv A238T (K80STOP). Horizontal bars represent median values. Isolates with range of MLC values (e.g., 100 to 200 μg/ml) are plotted using their mean MLC values. Isolates with an MLC value of >400 μg/ml are assigned a value of 800 μg/ml for display purposes. P value determined by Mann-Whitney U test.

