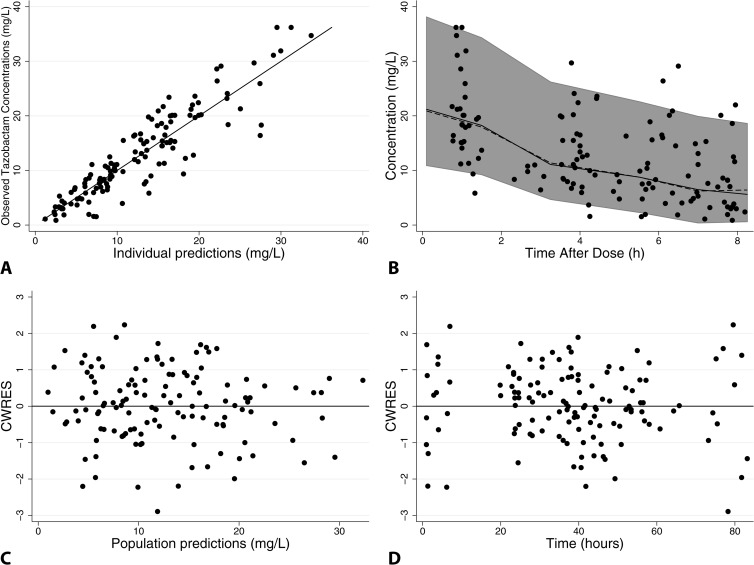
FIG 2.
Final tazobactam population PK model diagnostic plots: observed versus individual predictions (A), visual predictive check (B), and conditional weighted residuals versus population predictions (C), or time (D). For panel A, the line of identity is included as a reference. For panel B, solid black circles represent observed concentrations, the shaded gray area represents the 90% prediction interval, and solid and dashed black lines represent observed and predicted median concentrations, respectively. For panels C and D, a solid line at y = 0 is included as a reference.

