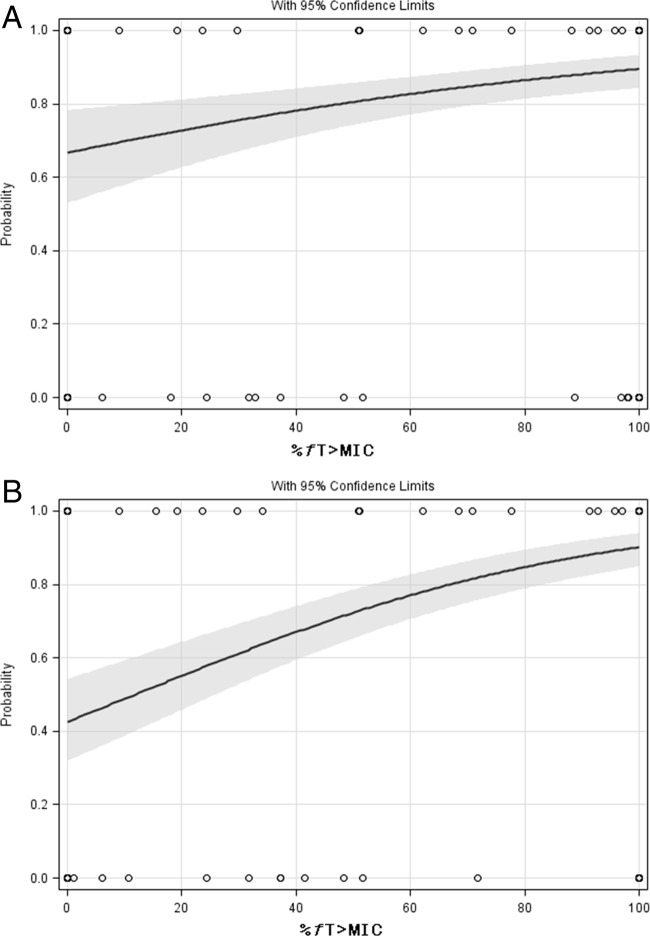
FIG 1.
Univariate logistic regression analysis of %fT>MIC for microbiological eradication at EOT for the exposure based on BL MICs (A) (n = 243) and based on BL/EOT MICs (B) (n = 251) for all patients. (A) P = 0.0002. The gray area represents the 95% prediction interval. (B) P < 0.0001. The gray area represents the 95% prediction interval.

